
Biography
 Ed Pegg Jr was graduated from
Artist Statement
“Back in 1998, I (EPJ) noticed the Fisher Pavers over at Adrian's site. I considered these carefully designed heptagons and squares quite clever. They could make some very nice designs, but I didn't find them chaotic enough. So, I started playing with Autocad LT, trying to find something better.” Ed Pegg Jr said.
Artwork Highlight:
Here is one his found, with fans, pyramids, corks, and a few triangles.
Here is a Mitre System tiling that just uses two shapes, and an occasional third.

Computing Process:

Core Shapes and Supporting Shapes of The Mitre System. Patent Pending by Adrian Fisher and Ed Pegg Jr.
Firstly, it is combination to a simple shape and than continues to add other core shapes and supporting shapes. The shape can become from simple to more complex.

The below is a piece of final product.

Analysis:
The art of traditional Celtic pattern is very complex. The Mitre system can help to find out the pattern of the Celtic pattern more easily.
Compare with the Hyperbolic Planar Tessellations by Don Hatch, Ed Pegg Jr tessellation is more extensible. The Hyperbolic Planar tessellation can only within in a circle but the Ed Pegg Jr ones can be widely used on the ground, glasses windows…
May be someday we can use the Mitre system combine with GA to automatic generate those patterns.
Link:
The Mitre System http://www.mathpuzzle.com/Mitre2.html.
Hyperbolic Tessellation http://www.hadron.org/~hatch/HyperbolicTesselations/
Case Study wk07 Visualizing complex analytic functions using domain coloring
0 Comments Published by Sam Leung on Wednesday, October 25, 2006 at 12:13 AM.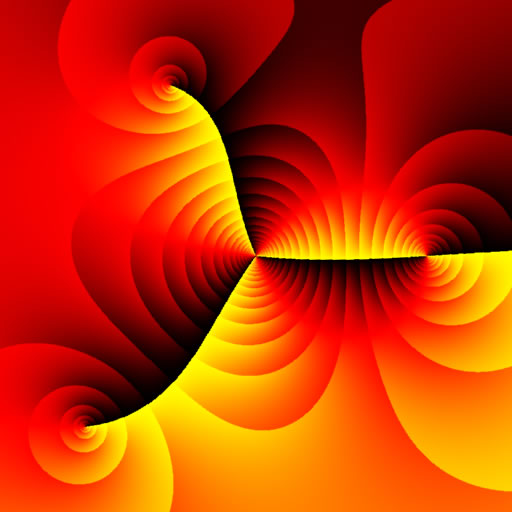
Biography
Hans Lundmark
 He was born on the 15th of April 1970 in Skellefteå, and moved to Linköping in 1990. You can find these cities on a map of
 He works at the Department of Mathematics,
Artist Statement
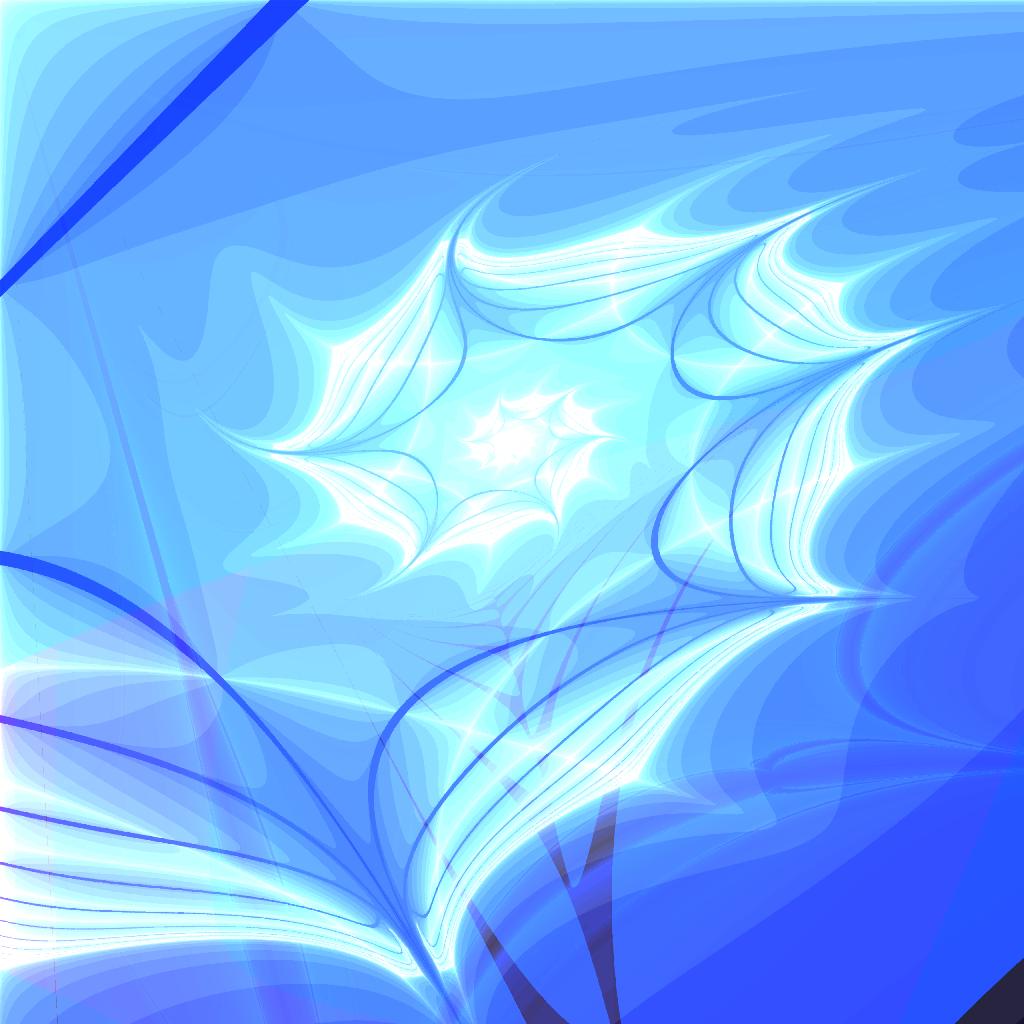
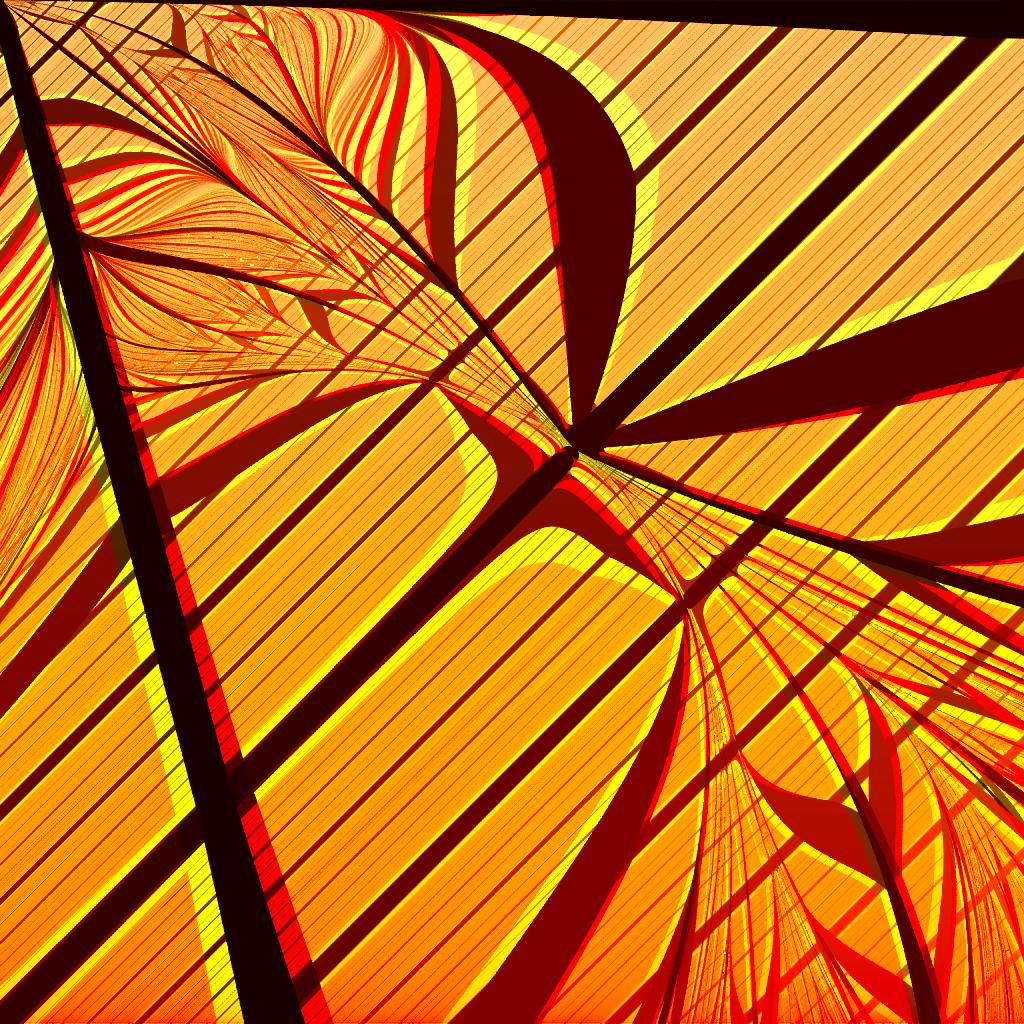
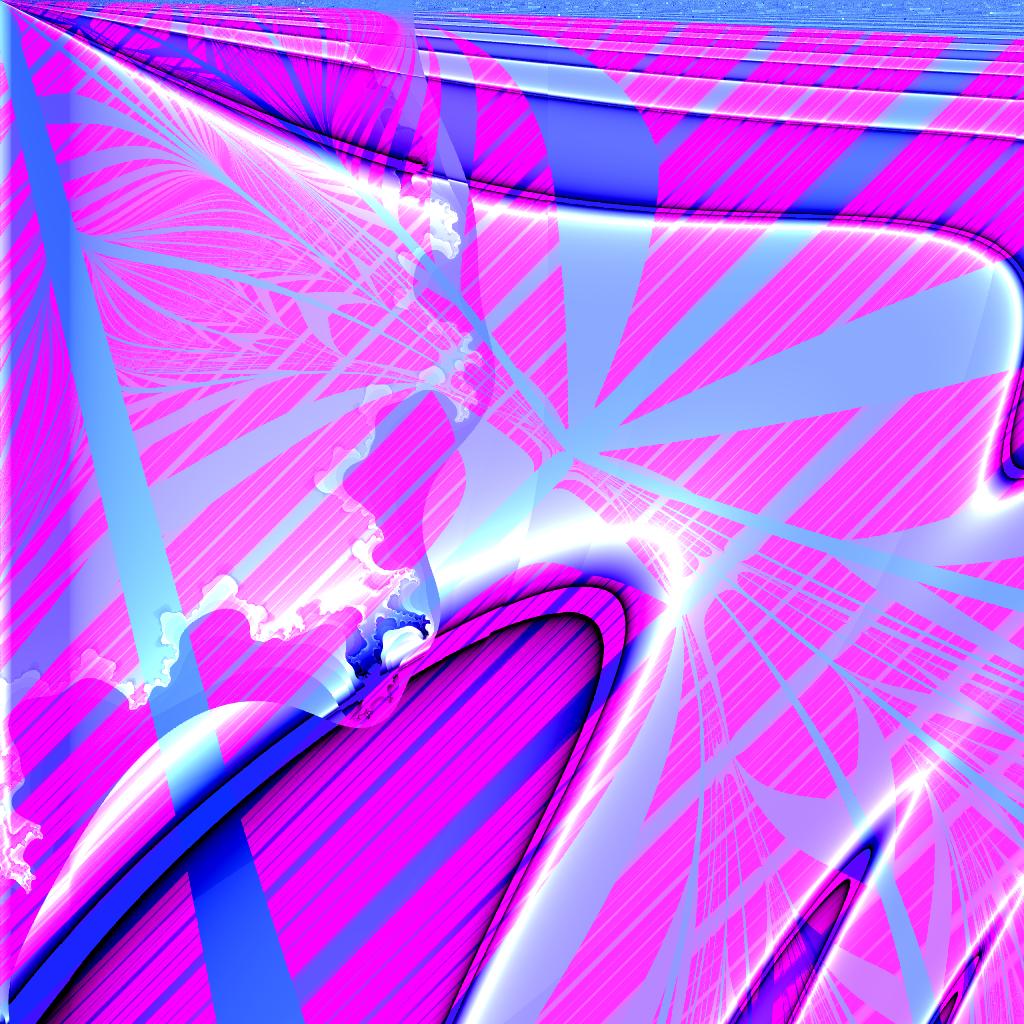
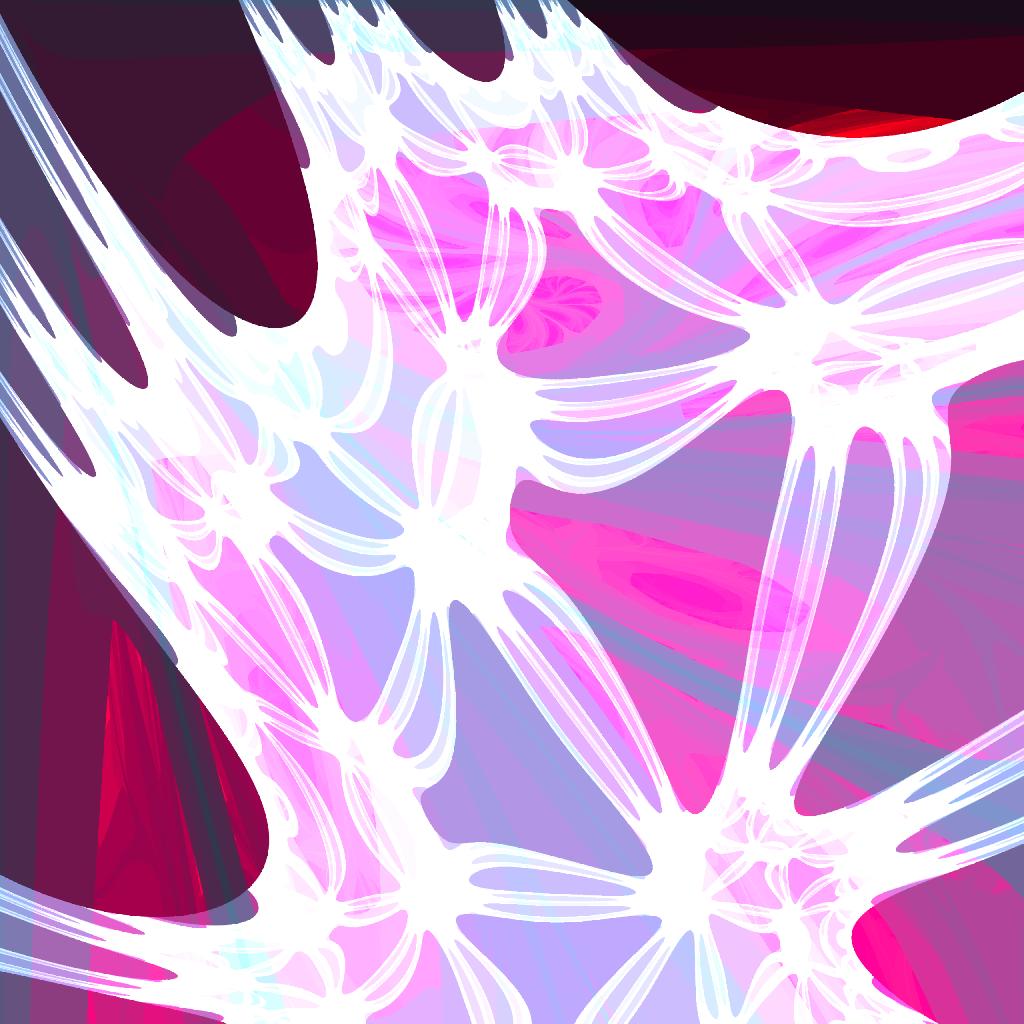
Visualization of complex-valued functions using the domain coloring technique

sources and sinks
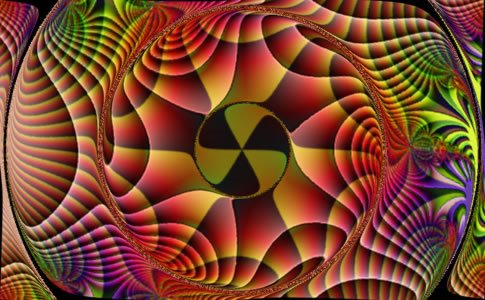
psychedelic

moebius chess

scales
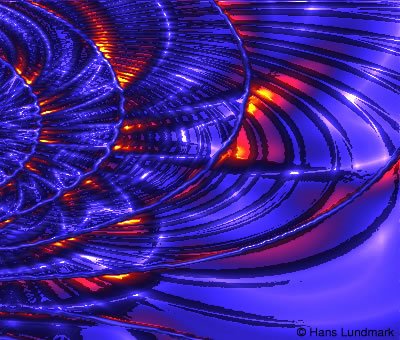
glowing rings
Computing Process:
Example. Below are two plots of the function f (z) = sin(z3−1) / z :
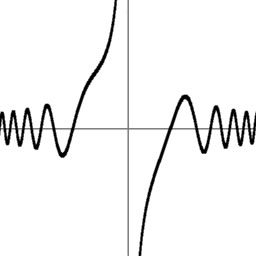

- An ordinary real plot y = f (x) from x = −3 to x = +3.
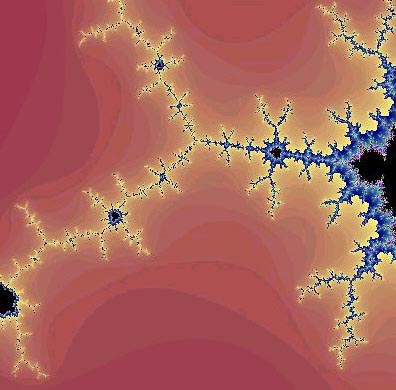
- A "domain coloring" complex plot over a square in the complex plane (lower left corner z = −3−3i, upper right z = +3+3i). Each point z is colored according to the value of f (z).
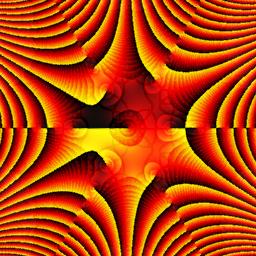
Virtually all information in the real plot can be read off from just the middle horizontal line z = x+0i in the complex plot (once you learn how to interpret it). But the complex plot also reveals new phenomena that can't be seen in the real plot.
Analysis:
Hans Lundmark artist is also using the mathematical algorithms to generate. He uses the infinite function as the draw tool. Comparing with other artist for example such as Frank A. Farris, Hans Lundmark artist is more emotional and can present more “stores”. The art give me feeling about the infinite and systematic.
Link:
Frank A. Farris http://www.maa.org/pubs/amm_complements/complex.html
wk 6 case studies David McAllister
0 Comments Published by Sam Leung on Wednesday, October 18, 2006 at 6:41 AM.
Biography
David McAllister has been programming computers for twenty-five years, since the age of nine. Computer Graphics has been his focus since the end of high school when David received his first job in the industry testing 3D APIs at Evans and Sutherland. In 2002 he received a Ph.D. in Computer Science from the
Artwork Highlight:


Computing Process:
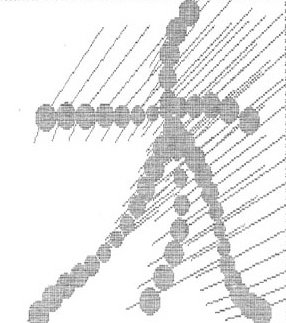
Genetic art:
This is genetic art. It is similar to or the same as evolutionary art, algorithmic art, or organic art. A genetic art image is defined using an equation or program that computes the color of each pixel (dot) in the image. The equation and its parameters are chosen randomly. The artist then chooses the best random images. These equations defining the best images are then used as parents and mutated and crossed over to create a new batch of child images. In this way the images tend to go from simple to complex and from less to more pleasing over time.
He originally wrote this program as a diversion during grad school in 1998. The images displayed in this gallery are descendents of those 1998 originals. Many have descended hundreds of generations. He has probably looked through a quarter million images over the last six years to create these.
Line:
The way the program works is it randomly generates some mathematical functions of x and y (such as 5 + cos(2.3 * sqrt(y + 1.1) - x)) and converts them into a picture. There are several ways of converting the equations to a picture. In the program available here, this conversion is done by evaluating the expressions with different values of x and y for each pixel in the image and converting the resulting number or numbers into the color at pixel x,y.
Color
He randomly choose one of three different ways to convert the equations to a color:
1) By making three functions representing the red, green, and blue primary colors that combine to form the color;
2) By making three functions representing the intensity, redness, and blueness (YCrCb); or
3) By making one equation that is an index into a genetically evolved color palette.
Genetic programming follows Sturgeon's Law - "Ninety percent of everything is crud," so this randomly generated expression will probably be boring and ugly. So He compensate for the probability of ugliness by generating lots of pictures, some of which will be interesting. The program displays an array of images and the artist can mix and match these images to get better ones. This is where the genetics comes in. Think of the images as an evolving population, whose fitness for survival is the image's appeal to the artist. The artist can enter a numerical score according to how much they like each child image, or can click on the most appealing images to select them as parents of succeeding generations. Then when the artist has selected all desirable children, the undesirable ones are replaced with a new generation of children. The new images are either randomly generated or are a mutation of one, or a cross between two existing images that have been designated as parents.
The population gradually evolves into more and more pleasing pictures. The artist will often choose a particular motif that pleases them and breed it over and over trying dozens of variations and crossing it with everything that looks interesting.
Analysis:
Genetic Art is using half computer and half human way to create the Art. It provides an easy way for artist to create the art from simple to complex via selecting the good and filtering the bad element. This is very useful.
Link:
Genetic art: http://home.comcast.net/~davemc0/GenArt/
Appendx:
Program spec:
DaveMc's Genetic Art Program, Version 2.0
Copyright 1998 - 2004 by David McAllister
Genetic art is represented as a set of one or three equations that compute the color of each pixel in the image based on its x,y coordinates. The genetic part is that the resulting images are given a score based on how much you like them. This score is their fitness to survive. The higher scoring individuals are then selected as parents of a set of children that are created through cross-over and mutation of the parents. Repeating in this way causes the images to keep getting more and more pleasing.
Genetic art was the idea of Karl Sims in 1990. There are about a dozen different people out there who have written programs that do it. Mine is now one of them.
=============================================================Starting the Program
The file format for storing the equations that make the pictures is .GNX. It's actually a text file. Each individual is four lines long. You can start the program either by itself or by dragging one or more .GNX files onto the program's icon. The program will take several seconds to load the file and will then draw the main program window and start drawing the individuals.
If you start the program by opening a file it will save back to that same file. It first makes a copy of the original file called filename_old.gnx. Each time it saves, it keeps the previous copy around as filename_bkp.gnx. Everything is autosaved once every four times you press the space bar.
=============================================================Using the Program
The program has two windows. The black DOS window prints stuff out. The main window is divided into three subwindows. From top to bottom they are the Child Window, the Parent Window, and the Zoo.
The Zoo
The zoo is on the bottom. It shows every individual that currently exists, including those also shown in the Parent or Child windows. Since you may have several hundred individuals in your zoo, you can scroll this window using the UP/DOWN keys or the PAGE UP/PAGE DOWN keys.
Left click an individual to select it as a parent.
The Parent Window
This is the little window in the middle. Click on individuals to put them here and let them be chosen as parents of new individuals. To send a parent back to the zoo, just left click on it.
When a new child is to be created, one or two parents are chosen from the parent window based on their scores. An individual with a score of 0.8 will be twice as likely to be chosen as an individual with a score of 0.4. Once the parents have been randomly chosen the child is created via mutation and cross-over. Portions of one individual are discarded and portions of the other are spliced in their place. This is done to the three equations and to the palette. Mutation is done by discarding part of an equation and putting a new random equation in the empty spot. The new child will have a score of 0.01.
If nothing is in the parent window, the new children will be created randomly. Many of these first generation ones look very boring. About one out of five new children are created randomly, even if there are parents available. This is supposed to increase the amount of variety.
The Child Window
This window is at the top. It contains the new individuals that have not been scored yet. You can tweak these as described below, or delete particularly ugly ones by clicking the middle button. But usually you choose the few that you like, then press SPACE to delete all the rest and make new ones.
With the ones you like, press '1' through '9' to give them a score of 0.1 through 0.9. This will also move them out of the Child window into the main zoo. Left clicking on them will will give them a score of 0.5 and move them into the parent window.
The window title contains lots of information. If it starts with "AA" it means it's doing some background rendering. If you press 'A' it will turn that off for a little while.
The first number is the index number of where in the zoo the selected individual is. 0 is at the top.
The next number is the individual's unique ID number.
Then comes the score. The "AA=1" means that this one hasn't been smoothed yet. When it has, it will say "AA=7". If you press 'j', then it will be re-rendered with 30 more samples per pixel and say "AA=31".
It then tells you the kind of image this is (RGB/YCrCb/ColorMap).
Next is the Generation. Images made from scratch are generation 1. Their children are generation 2 and so on. The child of two images with generations 5 and 12 will be 13. If a really nice image says generation 1, it's been around since before I started keeping track of lineage.
The next numbers are the unique ID numbers of the parents. If one of the numbers is -1, it means that it was a mutation of only one parent. If both numbers are the same, it means it was a cross-over of that parent with itself. If both numbers are -1 it means this individual has been around since before I started keeping track of lineage.
Finally, the title tells how things are sorted - by score, ID number, or generation.
=============================================================
Operations
Many operations work in all three windows:
Right Click Get a menu and a reminder of what keystroke does each thing
Space Bar Delete everything in the Child window and create new children. This also re-sorts everything. It also saves everything once every four times.
'e' Save all individuals to the .gnx file
't' Sort all individuals. This cycles between three ways of sorting:
- by score (biggest at the top)
- by unique indivdual number (oldest at the top)
- by generation number (earliest at the top)
'A' Toggle background rendering on/off. When on (the default) the program will first compute the image of every individual, even those not visible on the screen. Then it will recompute them all with antialiasing (smoothing) enabled. High quality antialiasing using 'j' is also done in the background.
'F' Reset scores of every individual to 0.01
'R' Measure how many different colors are in each individual and assign scores based on colorfulness. This isn't very useful.
'q' or ESCAPE Quit the program (You should press 'e' to save first.)
The following operations work in any window. They apply to the individual the mouse is hovering on when the key or menu item is selected.
Middle Button Delete this individual permanently
'0', 'd' or
'1' - '9' Give this individual a score of 0.1 through 0.9
'p' Print the equations and other info for this individual to the text window
'D' Delete everything from this individual in the zoo and lower. Be careful with this.
's' Save a medium-quality 512x512 image of this individual to disk. This may take a while. The filename will be G000xxxx.jpg, where the xxxx is the individual's unique ID number.
'S' Save a high quality 2048x2048 image of this individual. This may be VERY SLOW. It can take from 1 to 15 minutes.
'o' Save this and all images after it in the zoo at 512x512 resolution. This will take ALL NIGHT if you have lots of images.
'O' Save this and all images after it in the zoo at 2048x2048 resolution. This will take ALL NIGHT if you have lots of images.
'<' '>' Decrease or increase this individual's score
There are operations that tweak the appearance of an individual. These operations apply to the individual the mouse is hovering on when the key or menu item is selected. The pictures can be represented in one of three basic ways. They can be an RGB (red/green/blue) image, a YCrCb image (where the three values represent the brightness and chrominance), or a ColorMap image where the red channel tells which color from the palette to use at each pixel. Some images also use another variable, t. If the individual uses t, you can change t to slightly vary the shape of the image.
'r' Copy the red channel into the other two
'g' Copy the green channel into the other two
'b' Copy the blue channel into the other two
'x' Replace a little bit of the palette with a random color
'X' Replace the whole palette with random colors
'c' Cycle between RGB, YCrCb, and ColorMap styles
'C' Replace all the random numbers with slightly different ones (tweaks the shape of the image)
'j' Smooth the image a lot
LEFT/RIGHT Increase or decrease the t value (tweaks the shape of the image). This doesn't always make a difference.
When tweaking, it is a good idea to make the individual a parent, create a bunch of children, and tweak a child that looks like the one you're interested in. This will prevent you destroying the one you like.
An example of tweaking is to press 'c' to view the image in all three color modes. In RGB mode, if you can tell that only one of the channels is doing anything interesting, press 'r', 'g', or 'b' to make a gray scale image based on that channel. Then press 'c' to switch to palette mode. Press 'X' until it creates a palette you kind of like. Then press 'x' and hopefully it will make the palette even better. Press 'C' or the left/right arrows to tweak the shape a little bit.
wk05 Synestesia Project
0 Comments Published by Sam Leung on Wednesday, October 11, 2006 at 12:36 AM.
Biography

Lauri Gröhn: A
He started his industrial career in autumn 1976 in Kone Company in a group developing the first microcomputer controlled elevators. Then he worked in Telenokia (now called Nokia Telecommunications ) developing the first distributed digital switching systems. As a software QA manager he helped the company to survive without software crises by introducing the software configuration management methodologies.
Artist Statement
Using the method I have been developing one can generate music (midi files) from any pictures. Sculptural work is a good metaphor for the method: the sculptor starts from a block of stone or tree which inspires toward a certain end result. Synestesia Method is based on filtering pixels away and on using several selectable parameters. Going back to the sculpture metaphor, using parameters reminds of looking the sculpture from different angles or in lightning and environments. The picture on which the music piece is based and the list of parameters together form the metascore of the composition. The challenge is to find pictures generating interesting music.
Artwork Highlight:


Ciphers and Constellations in Love with a Woman
Computing Process:
http://www.synestesia.fi/method/synestesia_2003.html
Filtering the Picture
After getting the picture the software adds the r/g/b values of every pixel (mode 0) or multiplies them (mode 1). On every filtering round (parameter) those pixels having the largest pixel value are "carved away" (remember the sculpture metaphor). On image 1 the original picture is above, the next picture has been filtered (in mode 0) 10 times and 400 times. On the pictures below (mode 1) filtering has been used 100 times and 400 times. For the pixels left after filtering black color is shown. Typically less than 10 % of the pixels (left after filtering,) are used in the following phase.
| This picture shows which pixels were | |
Dividing the Picture
Depending on the number of tracks (parameter) the pictures is vertically divided into blocks.
The number of movements (parameter) defines how many pixels are available for every movement. On movement one dark pixels are used and later moments get the lighter pixels. The most common colour (black) has been filtered away). ( In the image all pixels has been shown as black.)
About the Parameters
Instruments, velocities etc. can be selected by using parameters or by using parameter sets where every track has its own values. The harmonies are built by selecting the number of vertical notes, minimum interval and pitch range (if smaller than the standard pitch range of the used instruments).
If the maximum pitch (parameter) has been set to 96 and the difference between the track pitch levels is 6, the highest pitch of track one is 96, track two 90 and so on. The software contains a table where the default pitch ranges of midi instruments are defined.
Reading Pixels
Pixels (changed to gray) are read vertically from top to down one track at a time depending on the harmony (parameter i) and thickness of the harmony (parameter m). If a pixel is missing a step i down is taken. The track is read from left to right as many times as there are movements (parameter) looking at only the pixels belonging the that movement. The time axis goes from left to right and the tempo (parameter) and the number on moments defines the length of the piece.
| pixels | i=2 | i=3 |
| * | x | x |
| * | | x |
| * | | x |
| * | | |
| * | x | |
| * | | |
| * | | |
| * | | |
| * | | |
| * | | |
| * | | |
| * | | |
| * | | |
| * | | |
Pitches
The pitches depend on the highs possible pitch of the piece (parameter), the relative pitch of the track compared to one above (parameter) and the selected scale. Any new scales can easily be created.
Remark: If one selects from the original picture two pixels, it is not necessarily possible to tell which is "played" earlier and which has higher pitch.
Note Lengths
A note will be triggered when on a certain track/movement one has a "rising edge" (analogy from process control) when following the pixels horizontally and the previous pixel was not used (usable). The note lengths are determined with the number of usable pixels starting from the triggering one. Notes for every track have the maximum length (parameter). On image A the parameter is 7 and on image B it is 4. The unit is minimum note parameter) that can be 1/8, 1/16 or 1/32 (parameter).
Velocities
The velocities of all notes are defined like this:
Analysis:
You cannot believe that is a computer generation. The Synestesia music is like a profession writer.
Lauri Gröhn art is more completion comparing with other this kind of generative music for example random art. As a listener, you can easily find out that the music of Synestesia is much better. In term of the structure, style and the feeling the Synestesia is better. Also the Synestesia support more tracks, which mean it, can has more composition.
And the ideas of the composer profiles have helped it become more human because there a sentence in Chinese says “All the article is just only a copy of others”. So the music is smoother than the others.
Link:
Synestesia http://www.synestesia.fi/
Random Art http://www.randomusic.com/samples/
Surfaces

Biography

Richard Palais's is a Professor Emeritus at Brandeis now.
After 37 years in the in the Brandeis Department of Mathematics, in 1997 I retired to have more time to work in the area of Mathematical Visualization, and more specifically to develop my Macintosh program 3D-Filmstrip (now called 3D-XplorMath). In the Fall of 2004, my wife, Chuu-lian Terng, resigned from
Artist Statement
In recent years I have become interested in mathematical visualization, and one of my major ongoing projects is the development and continued improvement of a program called 3D-XplorMath for MacOS X. This is a tool for aiding in the visualization of a wide variety of mathematical objects and processes. Based on what I have learned from my experience in writing this program, I wrote an essay called "The Visualization of Mathematics: Towards a Mathematical Exploratorium"![]() that appeared in the June/July 1999 issue of the Notices of the American Mathematical Society. With the help of Xah Lee, I have created a Gallery of visualizations produced using 3D-XplorMath.
that appeared in the June/July 1999 issue of the Notices of the American Mathematical Society. With the help of Xah Lee, I have created a Gallery of visualizations produced using 3D-XplorMath.
Artwork Highlight:


These families are parametrized by 4-punctured rectangular tori; they and their conjugates are embedded. We therefore suggest the associate family morphing, and also morphing of the modulus (aa) of the rectangular Torus, which changes the size
of the visible holes.
Computing Process:
For the visual appearance of these surfaces it is particularly important that the punctures are centers of polar coordinate lines. Formulas are taken from [K1] or [
Under suitable choices of the modulus of the Torus these surfaces look like a fence of Scherk SaddleTowers – with a vertical straight line (Je), respectively a planar symmetry line (Jd), separating these towers. The conjugate surfaces
look qualitatively the same in the Jd-cases and like a checkerboard array of horizontal handles between vertical planes in the Je-cases.

Above: “Borg cube”, a plot of the equation: Sin[x*y]+Sin[y*z]+Sin[z*x]==0.
Analysis:
Mathematical Surface gives people feeling more concrete. The grids help the object represent it as a mathematical object. For example, the last picture is also a mathematical surface however it is without any grids so it has not give people feel this is a mathematical surface, it just only a computer created object only. So the grids are very important. And the colors of the Richard Palais’s arts are also important. He uses the pure hue and light saturation, such as light blue, light brown. It gives people feeling more prototype and abstraction.
Link:
http://www.math.uci.edu/~palais/
http://vmm.math.uci.edu/3D-XplorMath/Surface/gallery.html
Labels: Surfaces
Biography
 Bogdan soban was born in Vrtojba in
However, he thinks that a computer can do more than simply data processing. So
Bogdan soban try to use his more than 15 years free time to produces computer art.
He developed a lot of programs using generative approach to generate always new and unpredictable pieces of visual art. Each artwork created using my genetic designed software is an absolute unique item and could be lost forever if not saved or printed.
Bogdan soban often present his artwork in the exhibitions and live presentation, articles and paper to broadcast the basic idea of generative art method.
Artist Statement
The main purpose of my project is to create pictures – artworks on the screen of the computer, to choose interesting and aesthetic examples and save or print them. Pictures are created using my own genetic designed software without applying any existing program of graphic design available in the world. At the beginning Bogdan soban used GWBASIC programming language but later Bogdan soban began to apply VISUAL BASIC. The method Bogdan soban use is known as “Generative Art”. Each picture created in this way is an absolute unique item, it was never be seen before and will never be repeated in future. Practically it exist the real infinite number of possibilities. Using the very simple example composed of three colored squares (16 colors of background, 16 colors of square, 100 different dimension of squares and 135.000 possible position of each square on the screen) it needs more than 80 billions years to see all possible combination creating one per second. It is nonsense to calculate the number of possibilities for a little more complex picture. For the human understanding it means infinite and so the unexpected result of the generative process could be a creation.
To realize unpredictable pictures Bogdan soban use random number generator calculating seed out of starting time value of the generative process. Theoretical could be possible to anticipate the image but not knowing the precise starting moment is quite impossible.
The other very important method of my approach is not to interfere with running program. During the creation of the image any communication with the program is impossible. It is absolutely free to create the picture. Bogdan soban also never change or elaborate generated image and if Bogdan soban don’t like it he leave it to be lost. And finally Bogdan soban never print the artwork more than once so Bogdan soban guarantee unique item with no copies.
Developing my programs Bogdan soban use pragmatic or mathematic instructions to define the rules by which such artworks are executed with different influences on the level of unpredictability of results. In the area of artificial design the pragmatic code type are used because we have to know the object we want to create, unpredictable is only its variant. Mathematic instructions are much more appropriated for creating art where we don’t need to have the least idea of the final result. Examining closely mathematic type of programs Bogdan soban discovered that until the program is alive the image exist in an immense 2D space because all mathematic expressions have definite values for all values of x and y in Cartesian coordinate system. Bogdan soban arranged one program that make me possible to “walk” up and down, left and right and discover how the image looks on different distances from the starting-point of the coordinate system. No canvas or screen limits any more, such an image exist in universe. Important is to apply right mathematic expressions that can create interesting shapes far from the point (0,0).
Artwork Highlight:
SYMMETRIC IMAGE


Computing Process:
Image properties: Picture
Result description: symmetrical image, curve-irregular shapes, iridescent colors
Basic concept: polar coordinates (radius r and angle fi) of the current pixel and some cycle-related random values used as the only variables to define the pixel color. Image forms and shapes are the consequence of color distribution (algorithmic programming approach).
Algorithm description: At the beginning a defined number of random values are generated which are later used as auxiliary constants. Then the program calculates polar coordinates for each pixel and uses them together with previous generated constants to calculate the RGB color components. There are two types of GRB components used: random defined in the beginning of each cycle (k1, k2, k3) and mathematically calculated (re, gr, bl). Image area is processing by columns from left to right.
Private Sub Command1_Click()
Call draw
End Sub
Private Sub Form_Load()
Form1.Show: Randomize Timer
Call draw
End Sub
Private Sub draw()
Randomize Timer
On Error Resume Next: Cls
n1 = 5 + Rnd * 5: n2 = 5 + Rnd * 5: n3 = 5 + Rnd * 5
f1 = Int(2 + Rnd * 10): f2 = Int(2 + Rnd * 10): f3 = Int(2 + Rnd * 10)
k1 = Rnd * 256: k2 = Rnd * 256: k3 = Rnd * 256
typ = Int(1 + Rnd * 7)
For i = 0 To 500: For j = 0 To 500
x = (i - 500 / 2) / (500 / 6): y = (500 / 2 - j) / (500 / 6)
r = Sqr(x * x + y * y): fi = Atn(y / x)
re = k1 * ((n1 + Sin(n1 * r)) + (n2 +
gr = k2 * ((n2 +
bl = k3 * ((n3 + Sin(n3 * r)) + (n1 +
If typ = 1 Then Picture1.PSet (i, j), RGB(re, gr, bl)
If typ = 2 Then Picture1.PSet (i, j), RGB(k1, gr, bl)
If typ = 3 Then Picture1.PSet (i, j), RGB(re, k2, bl)
If typ = 4 Then Picture1.PSet (i, j), RGB(re, gr, k3)
If typ = 5 Then Picture1.PSet (i, j), RGB(k1, k2, bl)
If typ = 6 Then Picture1.PSet (i, j), RGB(re, k2, k3)
If typ = 7 Then Picture1.PSet (i, j), RGB(k1, gr, k3)
Next j: Next i
End Sub
Analysis:
Art may be a mathematical model. Mathematical Model also is art. Bogdan soban use his mechanical engineering a science background to produce the art. He use the mathematical algorithm to generate the computer artwork non repeatable mean uniqueness. In this artwork, you can find what are the science people think more logical, organized feel comparing the artist find from Ken blogger.
Link:
Bogdan soban Home page: http://www.soban-art.com/index.asp
Symmetry artwork program: http://www.soban-art.com/short-symmetry05.asp
Words:
Other:
After graduating from grammar school in Nova Gorica, BOGDAN SOBAN registered at the Faculty of mechanical engineering in
All those years being in contact with computer programming never disappear from my mind the crazy idea that a computer can do more than simply data processing. Bogdan soban had in mention the possibility to simulate the human creativity especially in the area of visual art. This challenge caused the development of a very interesting project that was my favourite occupation more than 15 years on my free time.
 Hyperbolic Planar Tesselations
Don Hatch's is favor in designing computer graphics and computational geometry. He graduated at U.C. Berkeley, studied PhD in Mathematics. He is favors in Logic and Combinatorial Set Theory.
In 2003 April, He published "A $20 Holyhedron".
In 98 and 99, he demo a application called "From Outer Space to In-Your-Face" in SGI's booth at IITSEC and SIGGraph, which was the predecessor to Keyhole's EarthViewer3D.
Artist Statement
“A software engineering or R&D position that allows me to use my skill in designing simple robust solutions to well-defined challenging problems in computer graphics and computational geometry.”
Artwork Highlight:
Hyerbolic tessellations
 {p,q}:{3,7} Truncation:1
Computing Process:
Each tessellation is represented by a Schlafli symbol of the form {p,q}, which means that q regular p-gons surround each vertex. There exists a hyperbolic tessellation {p,q} for every p,q such that (p-2)*(q-2) > 4.
Enumeration of Uniform Tessellation:
A tessellation (a.k.a. tiling) is uniform if its faces are regular and its symmetry group (including reflections) is transitive on the vertices. A uniform tessellation whose dual is also uniform is called regular. A uniform tessellation that is not regular is called semi-regular. We'll consider spherical, planar, and hyperbolic tilings all at once, using "Schwarz polygons" (a generalization of Schwarz triangles) to generate the symmetry groups, and using a generalized Coxeter-Dynkin symbol to name the resulting tessellation. (The Wythoff symbol could probably be used instead, except that I find the Wythoff symbol to be horribly unintuitive and I don't see how to extend it to Schwarz polygons of more than 3 sides). We will only consider tilings composed of convex (non-star) polygons.
Analysis:
The tessellation is very attractive. The line can lead your eye into the symbol. You can feel the tessellation give you a dignity feel. The artist not only shows front view of the tessellation, he also shows the symbol in other view, the tessellation then become another beautiful artwork. Furthermore, this kind of tessellation can be reused in various patterns not only the “Schwarz polygons”. It can be replaced by other type of symbol. The artist can generate other kind of beautiful tessellation.
Link:
Tessellation http://www.hadron.org/~hatch/HyperbolicTessellation/
Schwars-Christoffel http://en.wikipedia.org/wiki/Schwarz-Christoffel_mapping
Wythoff http://en.wikipedia.org/wiki/Wythoff
Coxeter-Dynkin http://en.wikipedia.org/wiki/Coxeter-Dynkin_diagram
