Case Study wk07 Visualizing complex analytic functions using domain coloring
0 Comments Published by Sam Leung on Wednesday, October 25, 2006 at 12:13 AM.
Biography
Hans Lundmark
 He was born on the 15th of April 1970 in Skellefteå, and moved to Linköping in 1990. You can find these cities on a map of
 He works at the Department of Mathematics,
Artist Statement
Visualization of complex-valued functions using the domain coloring technique

sources and sinks
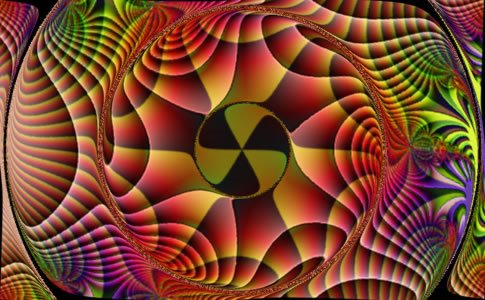
psychedelic

moebius chess

scales

glowing rings
Computing Process:
Example. Below are two plots of the function f (z) = sin(z3−1) / z :
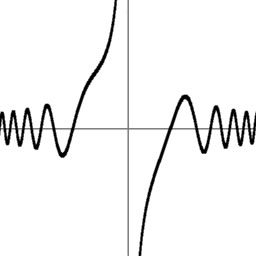

- An ordinary real plot y = f (x) from x = −3 to x = +3.
- A "domain coloring" complex plot over a square in the complex plane (lower left corner z = −3−3i, upper right z = +3+3i). Each point z is colored according to the value of f (z).
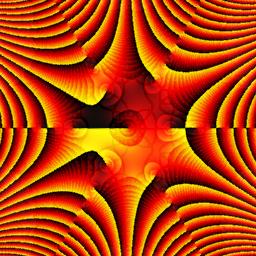
Virtually all information in the real plot can be read off from just the middle horizontal line z = x+0i in the complex plot (once you learn how to interpret it). But the complex plot also reveals new phenomena that can't be seen in the real plot.
Analysis:
Hans Lundmark artist is also using the mathematical algorithms to generate. He uses the infinite function as the draw tool. Comparing with other artist for example such as Frank A. Farris, Hans Lundmark artist is more emotional and can present more “stores”. The art give me feeling about the infinite and systematic.
Link:
Frank A. Farris http://www.maa.org/pubs/amm_complements/complex.html

0 Responses to “Case Study wk07 Visualizing complex analytic functions using domain coloring”
Post a Comment